Continuous Java Profiling
Capture metrics what matter, not what's possible to capture
Why another profiler?
Why do you need another Java profiler? I believe in shift-left approach - engineers must be able to test their code as early as possible.
Unlike conventional profiling tools, Sniffy injects a tiny HTML widget directly to your pages. The widget is always available in your development and test environments. You do not need to enable it explicitly after you face an issue - it is always on and monitoring your application performance.
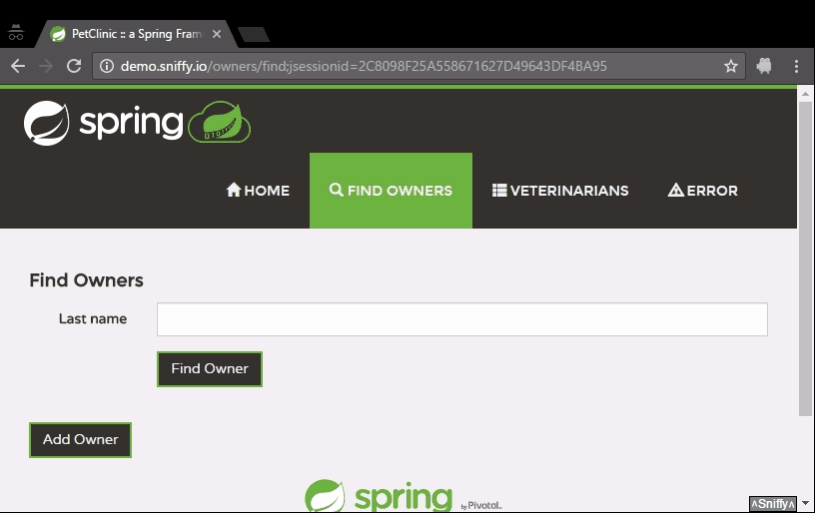
What does Sniffy do?
Sniffy shows the time it took to generate current page and any requests made from this page. Sniffy shows time to first byte and time to last byte as seen by your application. It allows you to focus on your application performance rather than on your test infrastructure.
Apart from time to first byte, Sniffy gives you insight into what downstream systems you use, what SQL queries you run, how many TCP round-trips they involve, etc.
Further reading
While Sniffy Widget is extremely helpful for investigations and exploratory testing, you should also invest into your test automation.
Sniffy allows you to verify number of SQL queries generated by your application or number of rows returned right in your unit tests.
Assertions on generic TCP operations are also available.